A Listed Investment Company (LIC) is similar to a Managed Fund. The main difference is that investors can buy and sell shares in a LIC on the Australian Securities Exchange (ASX) just like ordinary shares.
Unlike ETFs that track a benchmark, LIC managers are responsible for setting the funds objectives and selecting the investments. Often managers will set investment guidelines (i.e. only invest in companies in the S&P/ASX 200) and will aim to outperform the index by using active investment strategies.
LICs are “closed” investments, so unlike managed funds they don’t issue or cancel new shares as investors come and go. There’s a set number of securities issued and ASX investors transact LIC shares through their stockbroker just like ordinary shares.
Fees are varied but usually higher than ETFs (~1.0% -1.5% of net assets) and it’s common to have a performance fee (~20% of any returns above the specified benchmark).
As at May 2018, there’s over 80 LICs on the ASX.
 IMPORTANT
ASXLICs.com doesn’t provide share price data.
The best website is Market Index.
They have current ASX share prices, company charts and announcements, dividend data, directors’ transactions and broker consensus.
What type of LICs are there?
Most can be classified under four broad categories:
- Australian shares
- International shares
- Private equity funds that invest in unlisted investments
- Specialist funds that invest in special assets or sectors (e.g wineries).
Why select a LIC over an ETF?
The main reason someone would choose a LIC over an ETF is to chase Alpha (the return above a benchmark). This is achieved through the investment strategy of the fund and sometimes through the use of gearing.
ASX LICs (1 June 2020)
![]() Excel (CSV): Download
Excel (CSV): Download
| Code | Company | Market Cap | Weight(%) |
|---|---|---|---|
| 8IH | 8I Holdings Ltd | 35,814,200 | 0.08 |
| 8EC | 8IP Emerging Companies Ltd | 3,199,410 | 0.01 |
| AEG | Absolute Equity Performance Fund Ltd | 107,297,000 | 0.23 |
| ACQ | Acorn Capital Investment Fund Ltd | 47,751,600 | 0.1 |
| ACR | ACRUX Ltd | 26,966,200 | 0.06 |
| AIQ | Alternative Investment Trust | 27,678,900 | 0.06 |
| AMH | Amcil Ltd | 249,279,000 | 0.54 |
| APL | Antipodes Global Investment Company Ltd | 502,829,000 | 1.09 |
| ALI | Argo Global Listed Infrastructure Ltd | 313,713,000 | 0.68 |
| ARG | Argo Investments Ltd | 5,372,570,000 | 11.65 |
| ABW | Aurora Absolute Return Fund | 1,544,850 | 0 |
| AIB | Aurora Global Income Trust | 633,978 | 0 |
| AUP | Aurora Property Buy-Write Income Trust | 6,058,230 | 0.01 |
| AYF | Australian Enhanced Income Fund | 17,848,200 | 0.04 |
| AFI | Australian Foundation Investment Company Ltd | 7,371,120,000 | 15.98 |
| AGM | Australian Governance & Ethical INDEX Fund | 29,117,100 | 0.06 |
| ALF | Australian Leaders Fund Ltd | 176,537,000 | 0.38 |
| AUI | Australian United Investment Company Ltd | 1,018,130,000 | 2.21 |
| AIY | Authorised Investment Fund Ltd | 12,660,500 | 0.03 |
| BTI | Bailador Technology Investments Ltd | 99,516,000 | 0.22 |
| BHD | Benjamin Hornigold Ltd | 17,150,200 | 0.04 |
| BEL | Bentley Capital Ltd | 2,359,960 | 0.01 |
| BKI | BKI Investment Company Ltd | 1,055,460,000 | 2.29 |
| BAF | Blue Sky Alternatives Access Fund Ltd | 138,978,000 | 0.3 |
| BTC | BTC Health Ltd | 24,613,200 | 0.05 |
| CDM | Cadence Capital Ltd | 192,707,000 | 0.42 |
| CIN | Carlton Investments Ltd | 645,982,000 | 1.4 |
| CAM | Clime Capital Ltd | 87,470,400 | 0.19 |
| CLF | Concentrated Leaders Fund Ltd | 65,341,700 | 0.14 |
| CIE | Contango Income Generator Ltd | 62,940,400 | 0.14 |
| CVF | Contrarian Value Fund Ltd | 56,814,200 | 0.12 |
| CD1 | Cordish Dixon Private Equity Fund I | 33,941,900 | 0.07 |
| CD2 | Cordish Dixon Private Equity Fund Ii | 63,744,500 | 0.14 |
| CD3 | Cordish Dixon Private Equity Fund Iii | 79,591,400 | 0.17 |
| DUI | Diversified United Investment Ltd | 900,546,000 | 1.95 |
| DJW | Djerriwarrh Investments Ltd | 574,088,000 | 1.24 |
| D2O | Duxton Water Ltd | 164,141,000 | 0.36 |
| ECP | ECP Emerging Growth Ltd | 18,867,600 | 0.04 |
| EAI | Ellerston Asian Investments Ltd | 126,385,000 | 0.27 |
| EGI | Ellerston Global Investments Ltd | 112,145,000 | 0.24 |
| EAF | Evans & Partners Asia Fund | 146,949,000 | 0.32 |
| EFF | Evans & Partners Australian Flagship Fund | 27,752,300 | 0.06 |
| EGD | Evans & Partners Global Disruption Fund | 315,771,000 | 0.68 |
| EGF | Evans & Partners Global Flagship Fund | 192,946,000 | 0.42 |
| ECL | Excelsior Capital Ltd | 34,213,500 | 0.07 |
| FPC | Fat Prophets Global Contrarian Fund Ltd | 37,710,200 | 0.08 |
| FPP | Fat Prophets Global Property Fund | 17,767,100 | 0.04 |
| FSI | Flagship Investments Ltd | 44,884,800 | 0.1 |
| FOR | Forager Australian Shares Fund | 103,029,000 | 0.22 |
| FGG | Future Generation Global Investment Company Ltd | 476,833,000 | 1.03 |
| FGX | Future Generation Investment Company Ltd | 385,442,000 | 0.84 |
| GC1 | Glennon Small Companies Ltd | 28,102,100 | 0.06 |
| GFL | Global Masters Fund Ltd | 19,730,600 | 0.04 |
| GVF | Global Value Fund Ltd | 137,481,000 | 0.3 |
| GCI | Gryphon Capital Income Trust | 391,641,000 | 0.85 |
| HM1 | Hearts and Minds Investments Ltd | 681,750,000 | 1.48 |
| HHY | HHY Fund | 3,646,730 | 0.01 |
| IBC | Ironbark Capital Ltd | 53,577,400 | 0.12 |
| KAT | Katana Capital Ltd | 25,913,400 | 0.06 |
| KKC | KKR Credit Income Fund | 723,350,000 | 1.57 |
| LSF | L1 Long Short Fund Ltd | 881,873,000 | 1.91 |
| LSX | Lion Selection Group Ltd | 63,059,300 | 0.14 |
| LRT | Lowell Resources Fund | 19,832,200 | 0.04 |
| MGG | Magellan Global Trust | 2,251,400,000 | 4.88 |
| MHH | Magellan High Conviction Trust | 898,493,000 | 1.95 |
| MOT | MCP Income Opportunities Trust | 315,001,000 | 0.68 |
| MXT | MCP Master Income Trust | 1,213,430,000 | 2.63 |
| MMR | Mec Resources Ltd | 2,737,800 | 0.01 |
| MFF | MFF Capital Investments Ltd | 1,560,940,000 | 3.38 |
| MAX | Millinium's Alternatives Fund | 5,997,230 | 0.01 |
| MLT | Milton Corporation Ltd | 2,772,580,000 | 6.01 |
| MIR | Mirrabooka Investments Ltd | 366,847,000 | 0.8 |
| MMJ | MMJ Group Holdings Ltd | 27,594,500 | 0.06 |
| MA1 | Monash Absolute Investment Company Ltd | 46,871,400 | 0.1 |
| MEC | Morphic Ethical Equities Fund Ltd | 48,603,100 | 0.11 |
| NCC | Naos Emerging Opportunities Company Ltd | 49,118,600 | 0.11 |
| NAC | Naos Ex-50 Opportunities Company Ltd | 36,933,300 | 0.08 |
| NSC | Naos Small Cap Opportunities Company Ltd | 82,828,000 | 0.18 |
| NBI | NB Global Corporate Income Trust | 762,034,000 | 1.65 |
| NEW | NEW Energy Solar | 393,976,000 | 0.85 |
| NGE | NGE Capital Ltd | 18,208,300 | 0.04 |
| OPH | Ophir High Conviction Fund | 499,999,000 | 1.08 |
| OEQ | Orion Equities Ltd | 872,905 | 0 |
| OZG | Ozgrowth Ltd | 56,506,100 | 0.12 |
| PGG | Partners Group Global Income Fund | 457,979,000 | 0.99 |
| PIA | Pengana International Equities Ltd | 269,375,000 | 0.58 |
| PE1 | Pengana Private Equity Trust | 271,059,000 | 0.59 |
| PCI | Perpetual Credit Income Trust | 382,319,000 | 0.83 |
| PIC | Perpetual Equity Investment Company Ltd | 320,004,000 | 0.69 |
| PAI | Platinum Asia Investments Ltd | 354,657,000 | 0.77 |
| PMC | Platinum Capital Ltd | 354,392,000 | 0.77 |
| PL8 | Plato Income Maximiser Ltd | 424,149,000 | 0.92 |
| PAF | PM Capital Asian Opportunities Fund Ltd | 40,616,000 | 0.09 |
| PGF | PM Capital Global Opportunities Fund Ltd | 318,758,000 | 0.69 |
| QRI | Qualitas Real Estate Income Fund | 313,441,000 | 0.68 |
| QVE | QV Equities Ltd | 215,680,000 | 0.47 |
| RF1 | Regal Investment Fund | 252,473,000 | 0.55 |
| RYD | Ryder Capital Ltd | 73,445,900 | 0.16 |
| SNC | Sandon Capital Investments Ltd | 70,062,600 | 0.15 |
| SEC | Spheria Emerging Companies Ltd | 86,160,300 | 0.19 |
| SOR | Strategic Elements Ltd | 15,750,900 | 0.03 |
| SVS | Sunvest Corporation Ltd | 2,796,580 | 0.01 |
| TEK | Thorney Technologies Ltd | 64,321,300 | 0.14 |
| TGF | Tribeca Global Natural Resources Ltd | 79,279,200 | 0.17 |
| TGG | Templeton Global Growth Fund Ltd | 233,712,000 | 0.51 |
| TOP | Thorney Opportunities Ltd | 100,166,000 | 0.22 |
| VG1 | Vgi Partners Global Investments Ltd | 858,603,000 | 1.86 |
| VG8 | Vgi Partners Asian Investments Ltd | 467,502,000 | 1.01 |
| WAA | Wam Active Ltd | 44,056,200 | 0.1 |
| WAM | WAM Capital Ltd | 1,407,400,000 | 3.05 |
| WAX | Wam Research Ltd | 278,686,000 | 0.6 |
| WGB | Wam Global Ltd | 437,235,000 | 0.95 |
| WHF | Whitefield Ltd | 422,321,000 | 0.92 |
| WIC | Westoz Investment Company Ltd | 119,256,000 | 0.26 |
| WLE | Wam Leaders Ltd | 865,405,000 | 1.88 |
| WMI | Wam Microcap Ltd | 182,285,000 | 0.4 |
| WQG | WCM Global Growth Ltd | 222,735,000 | 0.48 |
| ZER | ZETA Resources Ltd | 40,270,000 | 0.09 |
Archived Lists
How do you value a LIC?
LICs by nature seek to outperform a benchmark. As they have a set number of issued shares, the LIC price can trade at either a premium or discount to the pre-tax Net Tangible Assets (NTA) of the fund.
Over time, LICs tend to revert to their mean premium or discount, so it’s important to be aware of where in the investment cycle a LIC is trading.
According to Bell Potter, the investment cycle of a large-cap LIC (market cap > $500m) is different to a small-cap LIC (market cap < $500m).
Large Cap LICs
Tend to trade at a substantial premium to their pre-tax NTA during poor market conditions, and lower premiums during improving market conditions.
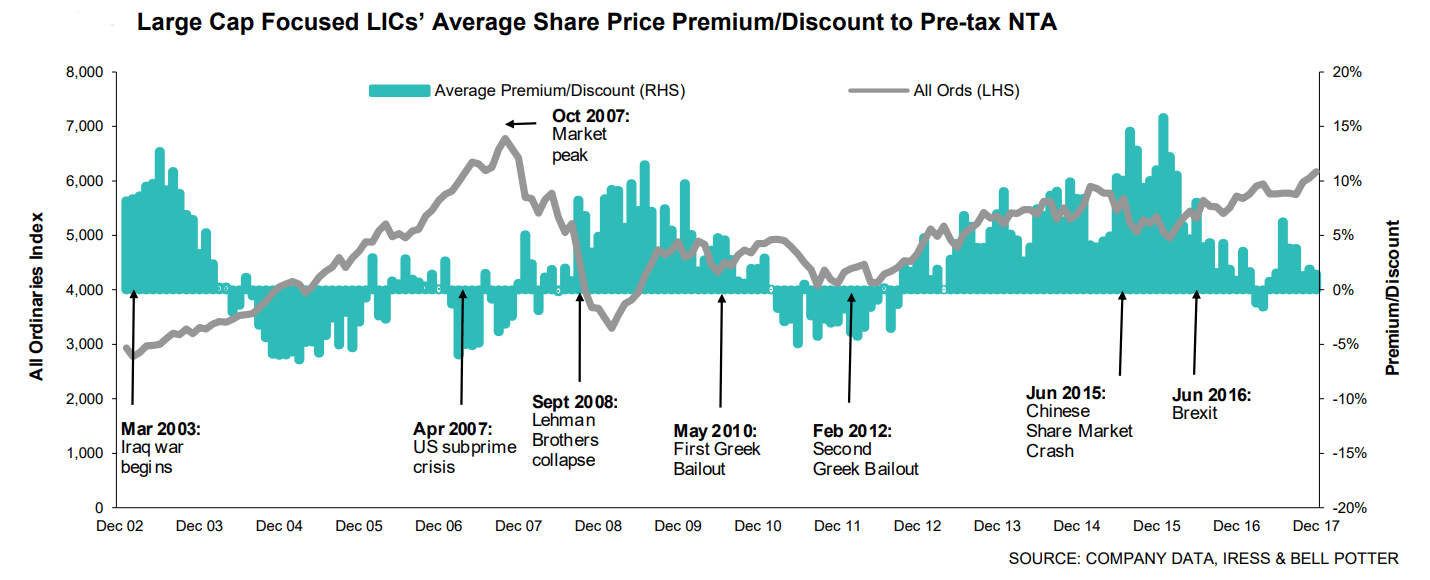
It could be argued that investors prefer the safety of large-cap LICs during bearish conditions but consider them “low return” investments during bullish conditions.
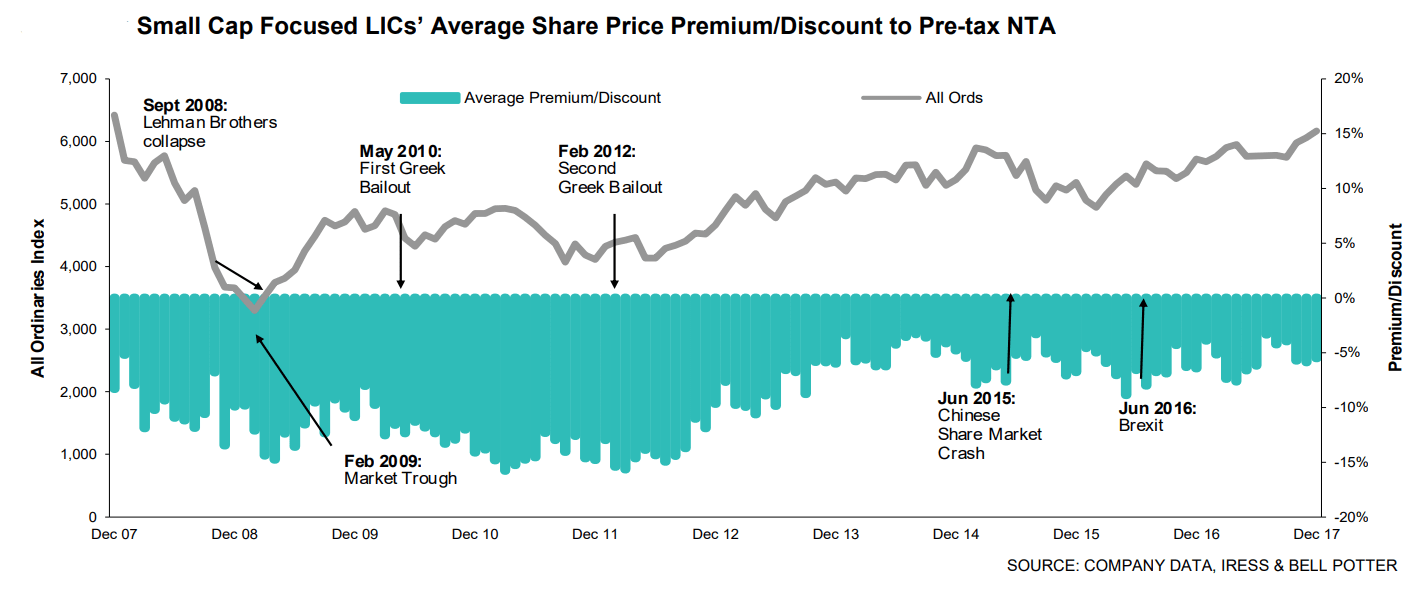
Small Cap LICs
Tend to trade at a small discount when investors are confident and large discounts when investors are negative.
Resources
Monthly LIC Reports - from Morningstar
Reference data - from Bell Potter